Mid-Year 2025
Credit Market Outlook Survey
Survey Backdrop
Despite persistent macro headwinds from geopolitical flare-ups to valuation mismatches, we find that deal appetite remains surprisingly resilient. In fact, the second half of 2025 is shaping up to be more active than many expected, but with clear signs that execution challenges remain.
The perspective that follows reflects the breadth of Antares’ market coverage across more than 500 active portfolio companies and sponsor relationships that span decades.
Methodology
The Mid-Year ‘25 survey was based on responses from 53 of Antares’ portfolio companies and 47 private equity (“PE”) sponsors, conducted in June 2025. The Mid-Year ‘24 and Year-End ‘24 surveys were conducted in June 2024 and November 2024, respectively.
Key Takeaways
Portfolio Companies
- Antares’ portfolio company respondents are less optimistic about U.S. economic growth over the next 12 months than they were at the end of 2024
- Despite macro concerns, most portfolio companies expect modest to strong revenue and EBITDA growth in 2025
- Portfolio companies’ 2025 performance drivers include implementing price increases, completing M&A, and either reducing or keeping headcount flat
Sponsors
- A majority of private equity sponsors are optimistic about buying a platform company in 2H 2025; conversely, sponsors have a mixed outlook on their ability to sell a portfolio company in this same time frame
- Headwinds to deal activity are a lack of high-quality deal flow and sponsors’ reluctance to sell below target valuations
- Appetite for Continuation Funds as a source of liquidity for sponsors has increased since year-end 2024
Company Performance Expectations Suggest Resilience in the Face of Slower Growth
While portfolio companies are less bullish on economic growth since our survey at the end of 2024 – with ~20% anticipating negative U.S. economic growth in 2026 and geopolitical risks increasing as a factor – a majority are still anticipating modest to strong revenue and EBITDA growth for the remainder of 2025. This is supported by optimism around industry demand drivers, the ability to pass on price increases and optimize margins, along with cost management with ~50% expecting headcount to be flat to down from prior year.
Deal Activity Outlook – Moderate Pace
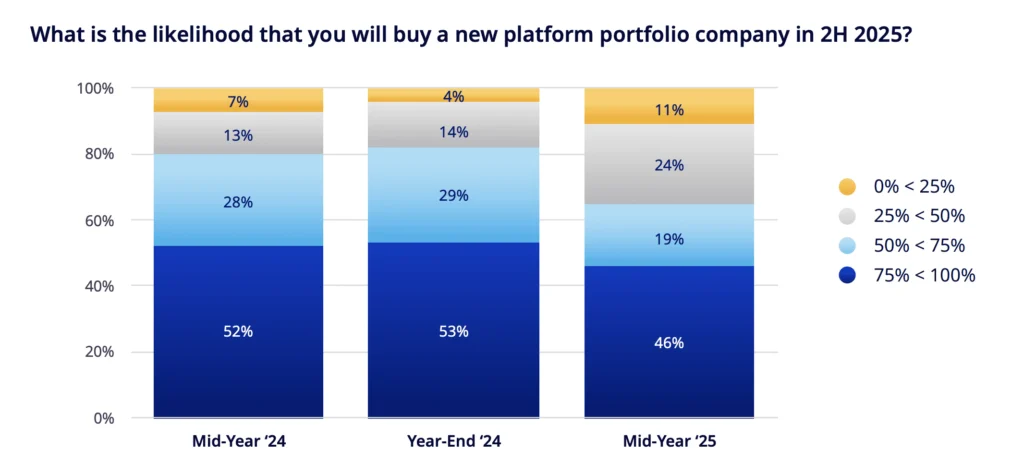
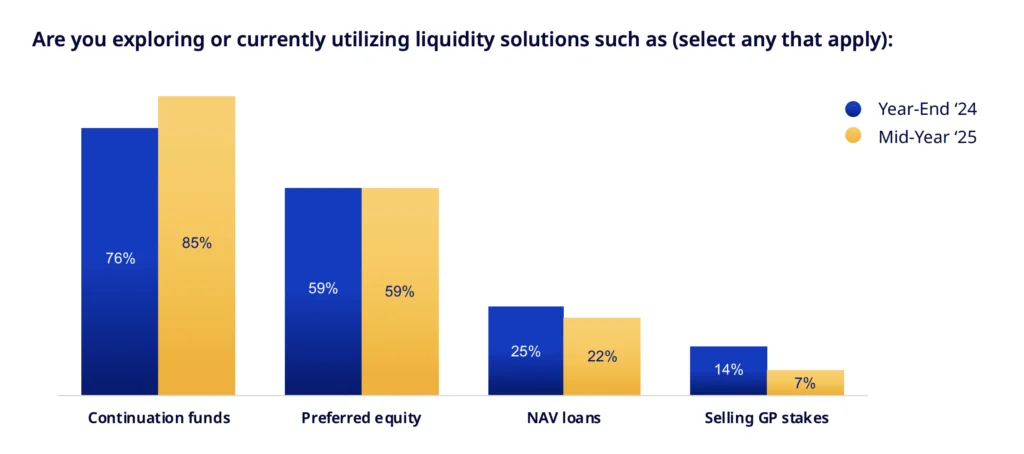
Both portfolio companies and private equity sponsors are eager to deploy capital for M&A. Portfolio companies cite M&A as their top capital priority this year and a majority of sponsors (65%) see higher than 50% odds of buying a new platform company in 2H 2025. However, conviction among sponsors buying a platform company is down from ~80% at year end with some citing lack of high-quality deal flow, misalignment on valuation expectations and regulatory uncertainty as key constraints. Sponsors remain reluctant to sell below their target valuations with 85% exploring or utilizing a continuation fund for liquidity – up from ~75% at year-end 2024.
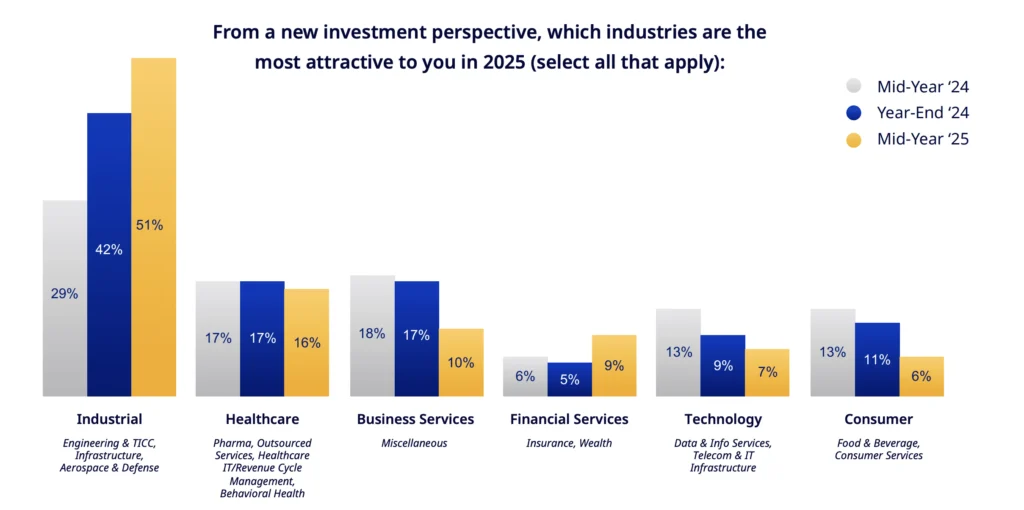
Interestingly, despite tariffs increasing as a top risk to their investment strategy, sponsors still view the industrial sector to be the most attractive for new investments, particularly within A&D, Engineering & TICC and Infrastructure subsectors.
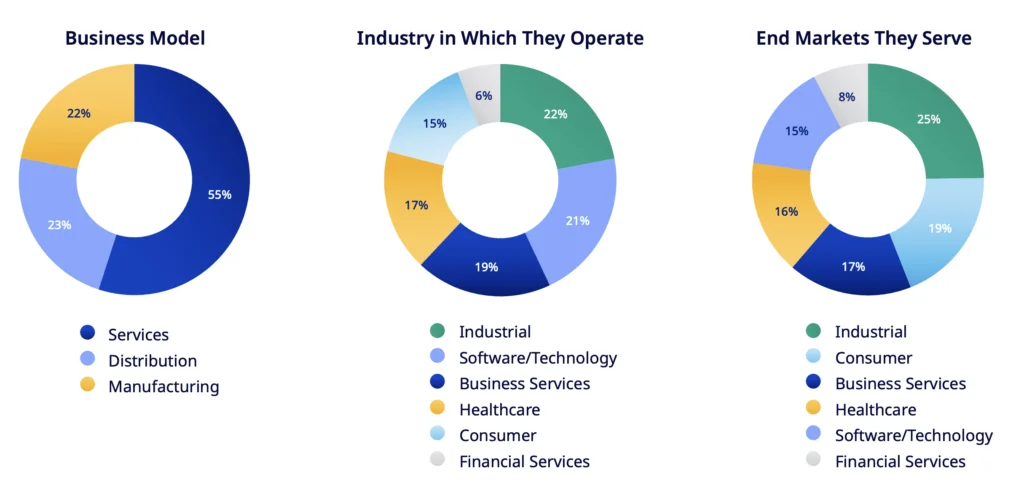
About Our Portfolio Company Respondents
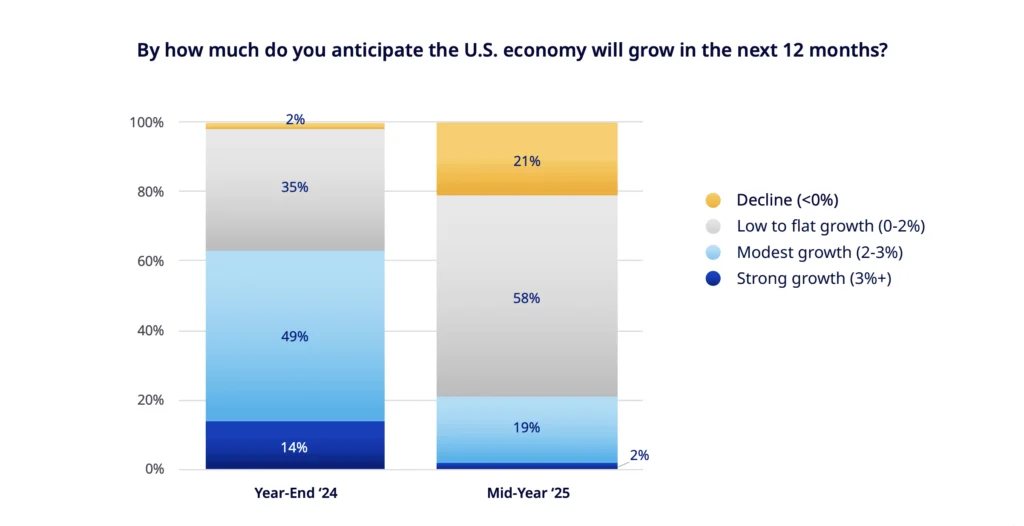
U.S. Economic Expectations
Takeaway:
Portfolio companies’ U.S. economic growth expectations have fallen, with most (58%) now expecting low/slow growth and 21% expecting economic contraction in the next 12 months.
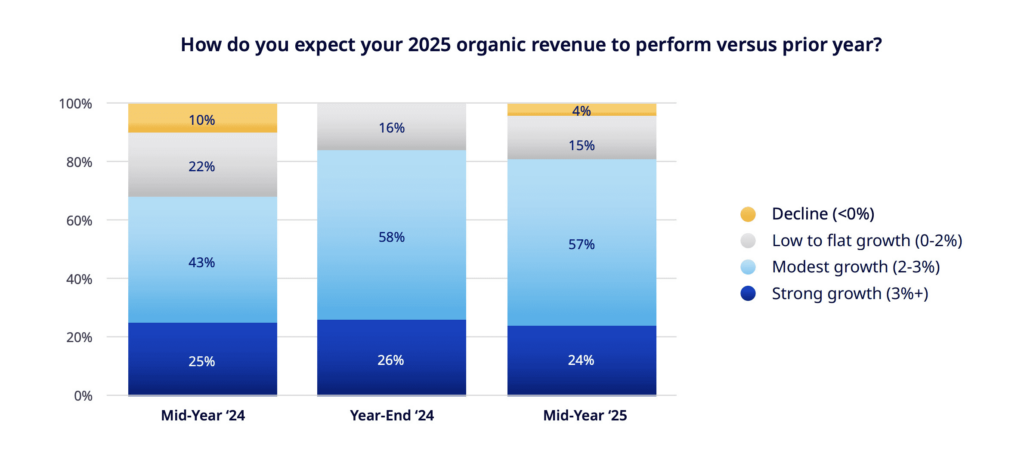
Company Performance Expectations
Takeaway:
Despite slower U.S. economic growth expectations, portfolio companies continue to see healthy organic revenue growth prospects for their firms, with expectations down only very slightly from yearend 2024.
“Optimism around future performance across a representative sample of our large, diversified portfolio is encouraging, particularly given the uncertain geopolitical backdrop. We remain focused on marketleaders in non-discretionary and highly defensible industries.”
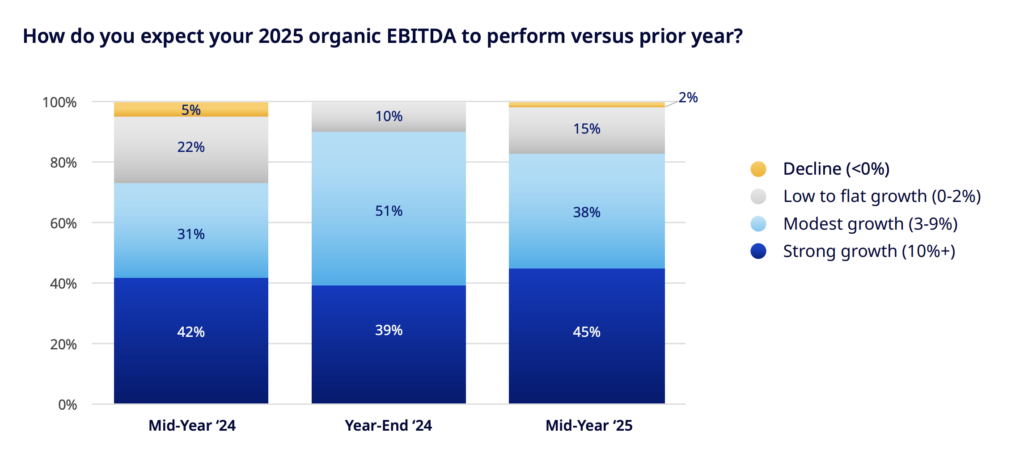
Takeaway:
Most portfolio companies remain optimistic about organic EBITDA growth, with 80%+ expecting modest to strong growth. While this is consistent with year-end 2024, expectations have become more varied – with more anticipating strong growth, but also a rise in flat or declining outlooks.
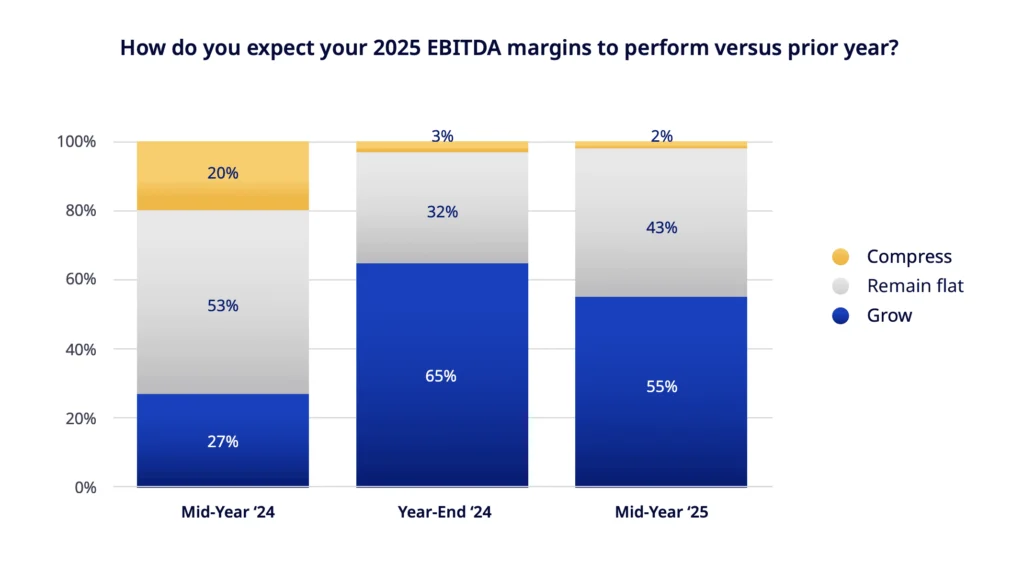
Takeaway:
A majority (55%) expect EBITDA margins to expand, with most of the balance expecting margins to hold steady—only a slightly less bullish outlook than at YE 2024.
Takeaway:
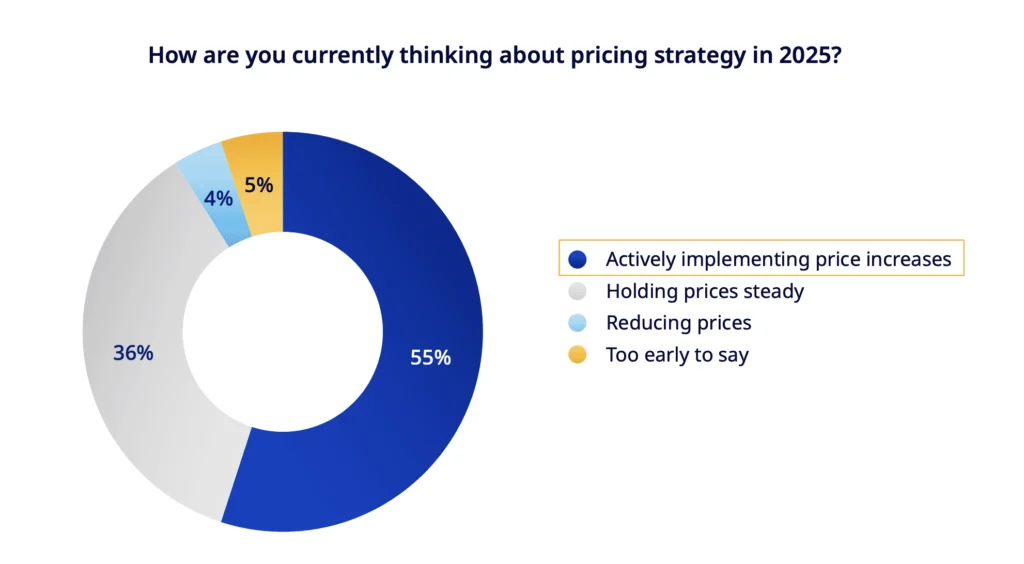
A majority (55%) expect to implement price increases, which supports organic revenue growth expectations and stable-to-improving margin expectations.
Takeaway:
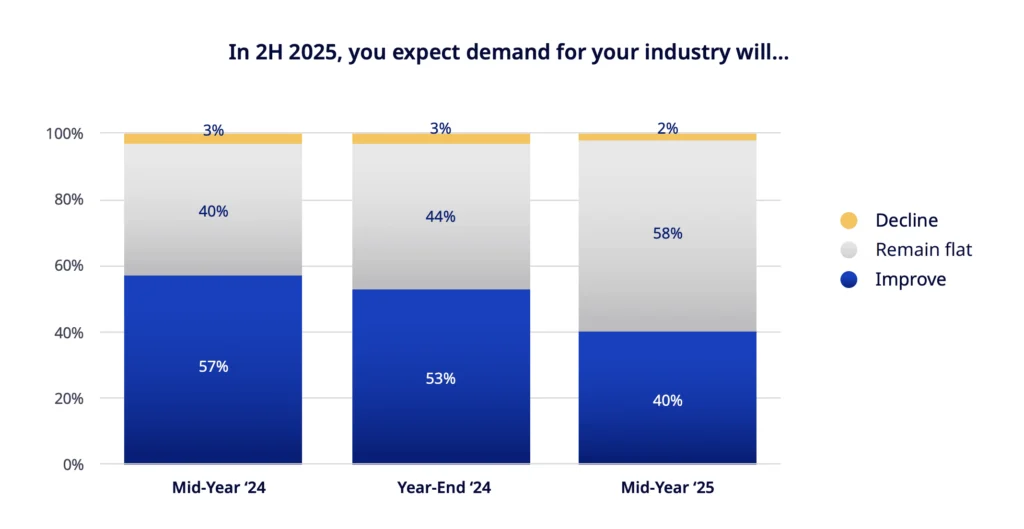
Portfolio company respondents’ expectations for growth in their respective industries appear to be decellerating, with the majority (58%) now expecting flat demand vs. a 53% majority expecting demand to improve at year-end 2024. However, only a very small percentage continues to expect a decline.
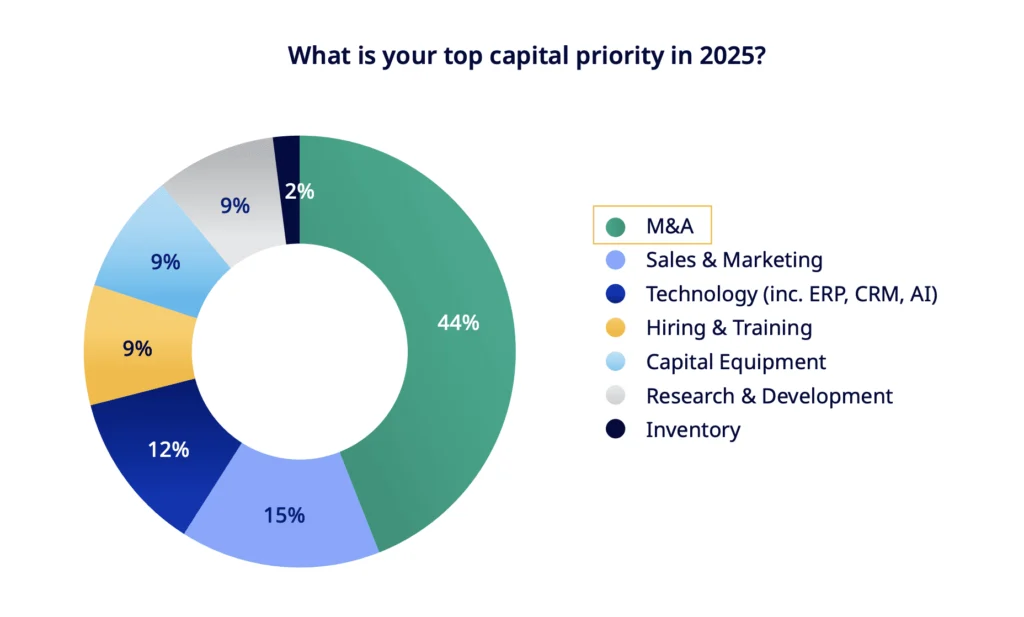
Capital Priorities Portfolio Companies
Takeaway:
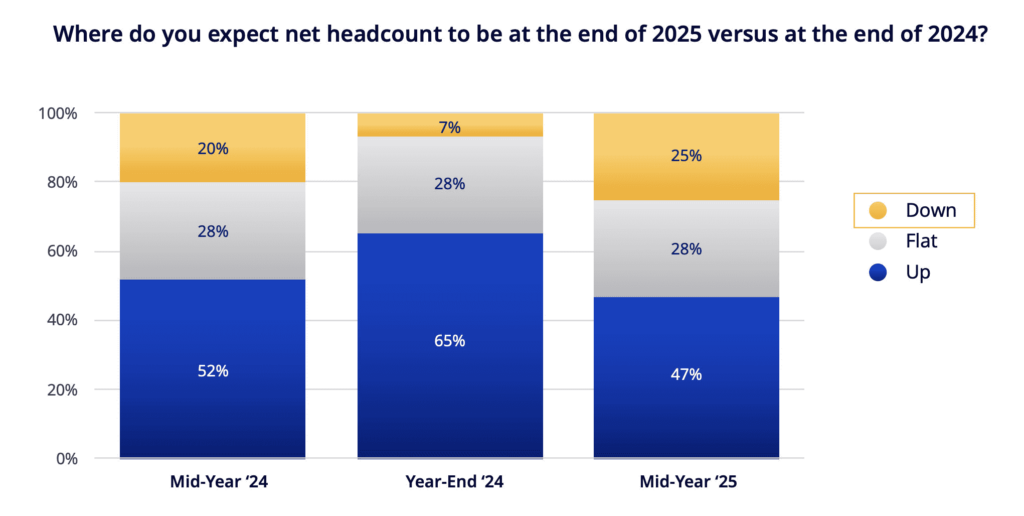
Nearly half of portfolio companies that responded expect to grow headcount, but there has been a significant increase vs. year-end 2024 (from 7% to 25%) in those expecting headcount reductions. Such reductions may support stable margin expectations – especially in combination with price hikes – despite slower anticipated demand growth.
Takeaway:
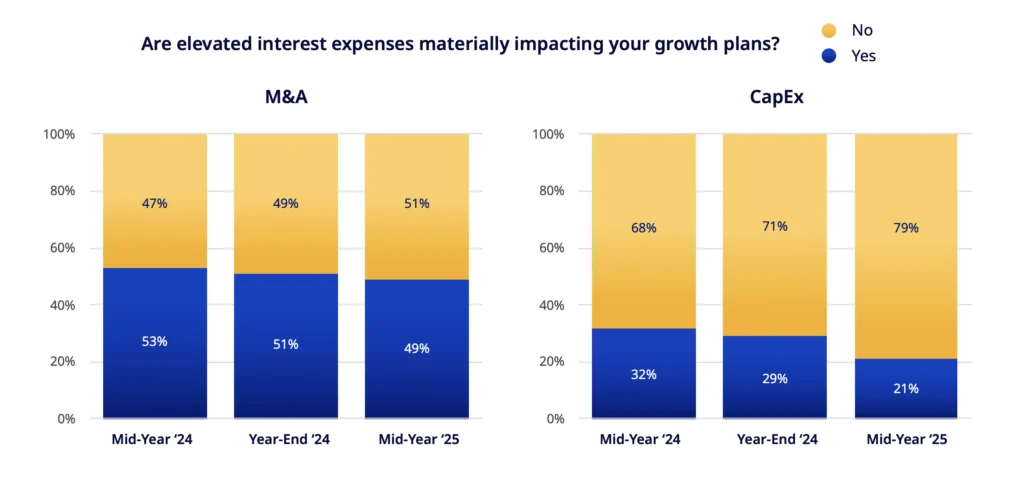
Elevated interest rates continue to be less of a drag on CapEx investment than M&A plans.
Takeaway:
M&A was marked as the top priority for capital deployment by portfolio companies by a wide margin.
Top Challenges for Portfolio Companies in 2H 2025
Takeaway:
Geopolitical risk understandably shot up to the top challenge as of mid 2025, followed by sales volume and interest rates, which remained top of mind. Tariff concerns moved up significantly, but labor supply declined as a concern.
Which do you view as your top 5 challenges for the remainder of 2025?
(Select a maximum of 5)
| Challenges | Year-End ‘24 | Mid-Year ‘25 | Change |
|---|---|---|---|
| Geopolitical Risks | 32% | 55% | 23% |
| Sales Volume Demand | 54% | 53% | –1% |
| Interest Rates / Fed Policy | 47% | 51% | 4% |
| Tariffs / Supply Chain Disruption | 33% | 49% | 16% |
| Labor Availability – Recruitment & Retention | 47% | 40% | –7% |
| M&A Execution | 12% | 30% | 18% |
| Expanding Market Share | 26% | 28% | 2% |
| M&A Integration | 12% | 26% | 14% |
| Industry-Specific Regulations | 12% | 19% | 7% |
| Implementing Price Increases | 26% | 17% | –9% |
| Labor Costs | 32% | 17% | –15% |
| DOGE Cuts / Public Sector Spending | N/A | 15% | N/A |
| Cybersecurity | 16% | 15% | –1% |
| AI Disruption | 4% | 13% | 9% |
| Company Culture | 11% | 13% | 2% |
| Inventory Destocking | 7% | 6% | –1% |
| Freight Costs | 4% | 4% | 0% |
| Raw Material Costs | 9% | 4% | –5% |
| Industries | Year-End ‘24 | Mid-Year ‘25 |
|---|---|---|
| Industrial | Tariffs | Tariffs / Supply Chain Disruption |
| Software/Technology | Sales Volume Demand | Geopolitical Risks* |
| Business Services | Interest Rates / Fed Policy | Sales Volume Demand* |
| Healthcare | Labor Availability – Recruitment & Retention | Company Culture* and M&A Integration* |
| Consumer | Organic Sales Volume Growth | Tariffs / Supply Chain Disruption* |
| Financial Services | Interest Rates / Fed Policy | Interest Rates, M&A Execution and Integration* |
*Indicates change from Year-End 2024 response
“In healthcare, we’ve seen the labor challenges of the post- COVID environment recede as labor availability and cost has seemed to normalize across most markets, and a renewed focus on M&A integration from a people, process, and systems perspective.”
Sponsor Deal Activity – Expectations & Drivers
“While sponsors remain somewhat cautious about the economic outlook following the shock of Liberation Day in April, the initial worst-case expectations have eased. We have seen a moderate increase in new deal activity heading into the second half of 2025, and we expect this steady pace to continue.”
Takeaway:
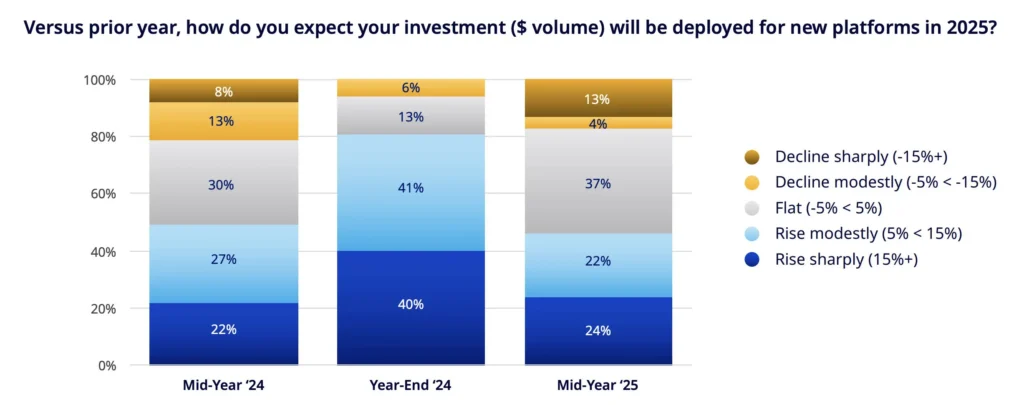
The percentage of sponsor respondents expecting to deploy more capital than prior year in new platforms has fallen to less than 50%, which suggests a less bullish sentiment than at year-end 2024.
Half of sponsors (48%) cited lack of high quality deal flow as the #1 reason for lower capital deployment in 2025, followed by #2 mismatched valuations (30%) and #3 regulatory uncertainty (15%)
Takeaway:
Sponsor respondents were mixed in their forecasts around selling an existing portfolio company in 2H 2025.

When asked, an overwhelming majority of sponsors do not expect that LP pressures to return capital will force them to exit investments below their targeted returns.
Takeaway:
Sponsors continue to consider alternative sources of liquidity to selling portfolio companies, with 85% considering continuation funds.
Top Industries and Subsectors of Interest for Private Equity
Takeaway:
Industrials – in particular, Engineering & TICC, Infrastructure and A&D segments – is an area of increasing interest. Financial Services (e.g. Insurance, Wealth) also rose in interest vs. YE 2024.
Private Equity Sponsors’ Top Risks to Portfolio and Investment Strategy in 2H 2025
Takeaway:
Tariffs and monetary policy have risen to the top-of-mind risks for sponsors with geopolitical risk remaining high. Labor cost risks have diminished.
Which do you view as your top 3 risks to your portfolio and investment strategy heading into 2025?
(Select a maximum of 3)
| Challenges | Year-End ‘24 | Mid-Year ‘25 | Change |
|---|---|---|---|
| Tariffs / Supply Chain Disruption | 26% | 62% | 36% |
| Monetary Policy / Interest Rates | 22% | 56% | 34% |
| Geopolitical Risk | 49% | 42% | –7% |
| Inflation | 29% | 36% | 7% |
| Labor – Cost, Availability, Recruitment, Retention | 38% | 24% | –14% |
| AI Disruption | 15% | 13% | –2% |
| Industry-Specific Regulations | 10% | 11% | 1% |
| Write-In: Recession | N/A | 11% | N/A |
| DOGE Cuts / Public Sector Spending | 13% | 4% | –9% |
| Cybersecurity | 8% | 4% | –4% |
| Write-in: Consumer Confidence | N/A | 4% | N/A |
“What are we watching? Monitoring our portfolio companies’ adaptive resiliency and pricing power in the face of potential stagflationary headwinds of slowing growth and tariff related rising input costs in 2H 2025 is a key area of focus. The path of interest rates and seemingly ever-present geopolitical risk also remain top of mind.”
Disclosures
The materials presented herein are proprietary to Antares Capital LP and its affiliates (collectively, “Antares Capital”).
These materials are being provided solely for informational purposes only and are not intended to be a recommendation or advice of any kind, and shall not be construed to create any fiduciary, advisory or other relationship, or the provision of any investment advice or service. These materials are not, and should not be construed to be, a proposal, a commitment, or a contract to lend, provide any financing, or sell any securities or financial instruments, or an offer to enter into any of the foregoing, and shall not be deemed to obligate Antares Capital in any manner whatsoever.
Antares Capital does not represent or warrant the accuracy, completeness or reliability of any of the information contained herein, either expressly or impliedly, for any particular purpose, and shall have no duty to update or correct any such information. Recipient agrees that it will not rely on the information contained herein, and will conduct its own due diligence. In no event will Antares Capital be liable for any losses or damages arising from or as a result of the use of the information or the materials contained herein. Past performance is not a guarantee of future results.
Any statements involving matters of opinion or estimates, whether or not so expressly stated, are set forth as such and not as representations of fact, and no representation is made that such opinions or estimates will be realized. The statements and expressions of opinion contained in this presentation are subject to change without notice and involve known and unknown risks, uncertainties and other factors, and undue reliance should not be placed thereon nor should they form the basis of an investment decision.
The materials presented herein may contain information concerning economic trends, performance and market analysis and such information may be based on or derived from information provided by our sponsor or borrower relationships who were not compensated for completing the survey. Antares believes that such information is accurate and that the sources from which it has been obtained are reliable; however, none of Antares nor any of its affiliates or agents can guarantee the accuracy of such information and they have not independently verified and are not responsible for any inaccuracies, omissions and dated information contained in such third-party information or the criteria and assumptions on which such information is based. Certain other information regarding market analysis and conclusions could be based on opinions, criteria or assumptions (including those of Antares) that Antares considers reasonable. Such market analysis and conclusions represent the subjective views or beliefs of Antares.
Expectations and views are as of July ‘25, the date of publication, and subject to change.